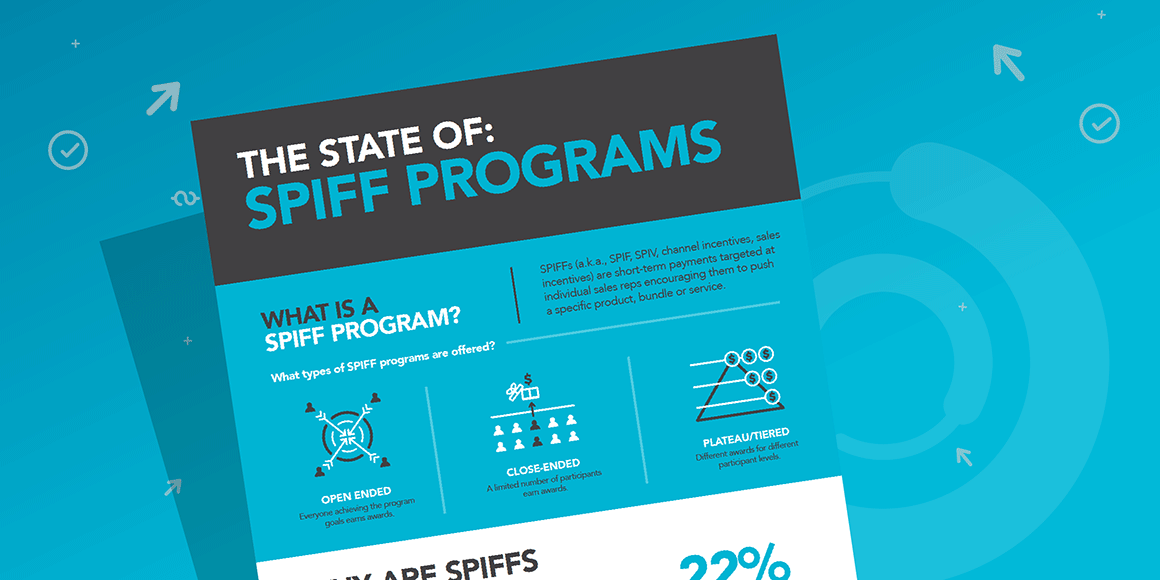
“Does your SPIFF program still work?” “Do sales SPIFs actually work?” These are common versions of the same question that have popped up for us in dozens of conversations since day one at 360insights. It’s a perfectly sound question really; sales SPIFs are an incentive tactic nearly as old as sales itself, so while one might expect the tactic to get tired, we also need to remember why incentives work at all.
Properly planned and executed incentives push buttons in our brains that leverage our human nature. We’re born with an innate desire to change. To oversimplify: without any radical rewiring, the right incentive is just triggering what is already there.
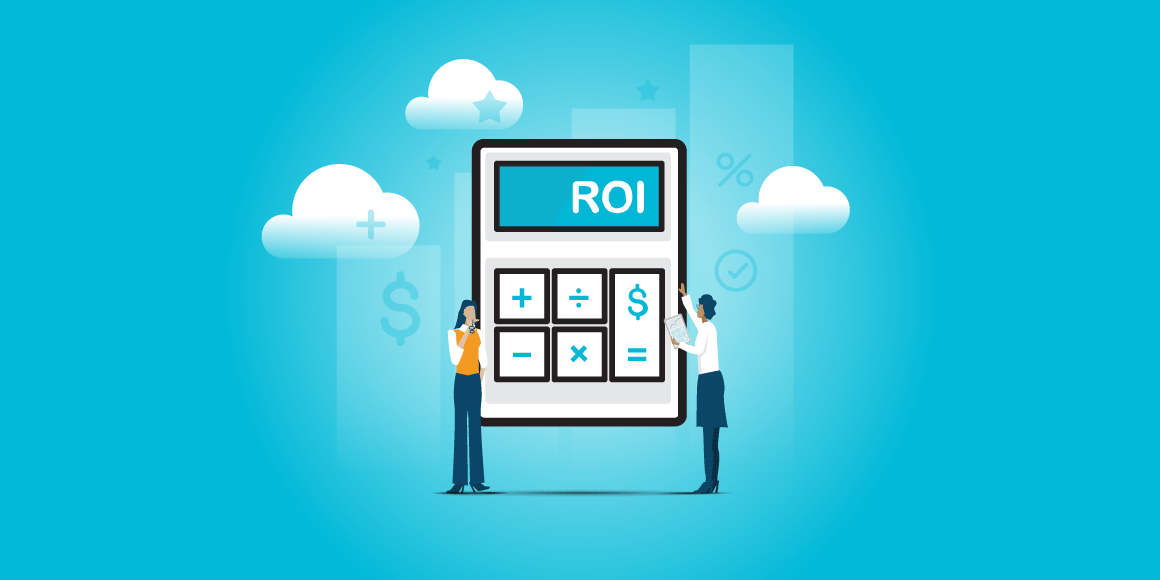
The more critical business question then becomes the cost to change the behavior versus the value it returns, or the SPIFF program ROI. After all, many brands spend tens or even hundreds of millions of dollars on incentives in a year, and most agree it's working at some level. Even in today's data-driven world however, many are still confused as to how to quantify or express the return on their SPIFF investment.
Fortunately, a recent 360insights customer case study provides us with some excellent principles and tactics for measuring SPIFF program ROI. The client, a manufacturer of consumer household goods, was looking to do an in-depth data study with the intent of leaning down their incentive programs and making them smarter.
The brand was not necessarily looking to spend less on incentives, but more wanting to make sure they were maximizing ROI. By pulling data from tens of thousands of transactions across hundreds of their current and past incentive programs, they were able to create a baseline and measure ROI for their SPIFF program to a marvelous effect. Here's the framework for how they did it:
Control Groups
As the use of data insights to guide business decisions becomes more pervasive, one of the things marketing folks need to do is embrace a scientific approach. In this case study, the cornerstone of the client team’s measurement sits with their ongoing use of control groups.
The company's sales channel is composed mainly of many thousands of retail partners, and the original baseline study was able to break those partners into three separate control groups:
- Retailers on a national SPIFF program
- Retailers on non-national SPIFF program
- Retailers on no SPIFF program
The importance of having control groups cannot be overstated. When testing a new program, this client always tests with at least two control groups – one set of retailers on the program, and one not on the program. Put differently; you can't necessarily say for sure a program is working if you can't point to a model where you can measure the result without it.
Start Simply
The baselining and refining exercise for this client was the result of a drive to simplify and bring structure to the way they approached incentives. A merger with a large competitor set them into a comparison of legacy programs to determine what was working and what wasn’t.
Using as much historical data as they had available, the company then measured baseline performance for each group, simply looking at the ratio of incentives paid to the sales volume. This is an essential principle for successfully incorporating data insights into your marketing; start simply, ideally with one solid indicator. Optimize for that indicator, and then look for other measurements or elements to add to your ROI analysis.
Measuring SPIFF Program ROI
To calculate SPIFF program ROI you’ll need to work with the following variables:
S = Revenue from the SPIFF group.
C= Revenue from the control group
R1= Number of resellers in the control group
R2 = Number of resellers in the SPIFF group
I = Total program spend
Take the revenue of both the control group and the SPIFF group and divide each by the number of resellers in each group. This gives you the revenue per reseller. Then subtract average revenue of the control group from the SPIFF group. This gives you the incremental revenue created from the SPIFF. Then multiply that number by the number of total resellers receiving the SPIF and divide it by the total amount of SPIFF dollars paid. This gives you the ROI. The formula looks like this:
(((S/R2) – (C/R1))*R2)/I)
This equation produces the ROI expressed as a percentage. A positive ROI is expressed as a positive value and likewise, a negative ROI is a negative value.
In our client case study, the client used their past performance data to project out what would happen if they did absolutely nothing; considering run rating, historical performance, seasonality, and built a forecast from there.
To measure ROI of their SPIF programs, the team then looked at the baseline, projection and actual numbers for each of their control groups. They measured projected lift vs. actual lift vs. total program spend and extracted and express their ROI measures from there.
As a result of this simplification exercise, this client has built a strong foundation to run effective, flexible, repeatable and predictable SPIFF programs. Having the discipline to strip everything down and start from scratch has given their team the freedom to focus optimizing other factors in their programs that have built value for both their retail partners and the brand. For example, they’ve used the 360insights platform to get better information on what price their products are being retailed for, which helps them understand how the programs are driving margins (thereby value for partners) alongside volume.
The most important part to remember is to isolate a group with the SPIF and one without it. The performance difference is the incremental value produced by the SPIF. The ROI is simply this divided by the investment made in the SPIF program.
Learn more about 360insights, channel incentives, rebates, Co-Op/MDF, volume incentives, and sell-through allowances by clicking here.